This post grew out of research I did to prepare a discussion about income in the United States for my church’s discussion group. As I prepared the presentation materials for the opening of discussion, I learned quite a bit about how fortunate I was and how things fit together. This post is based on the following references.
- Income, Poverty, and Health Insurance Coverage in the United States: 2012, United States Censure Bureau Report P60-245, 2013.
- http://en.wikipedia.org/wiki/Income_inequality_in_the_United_States
- http://www.bls.gov/oes/current/oes_nat.htm
An understanding of this information is important to making both personal and public policy decisions.
Standard of living
How much income does it take to support an individual or household in the United States? I was surprised to learn these figures. Unfortunately, I’ve forgotten the source so take these as 2013 thumb rules
- $30,000 individual self-sufficiency possible
- $40,000 individual savings for retirement and set backs
- $10,000 per additional member of the household.
The $30,000 figure represents the income needed to live independently and provides basic housing, transportation for work, food security, and basic health care in the absence of chronic diseases or injury.
The $40,000 figure represents savings for retirement and for maintenance of reserves to meet minor health emergencies, out of work contingencies, save to replace a vehicle, etc.
The $10,000 figure represents the incremental cost of adding an additional non-working resident to the household. Thus, a single head of household with 2 children requires $50,000 for a basic standard of living and $60,000 for a secure standard of living. For a two parent household, raise these figures to $60,000 and $70,000.
Individual Income Distribution
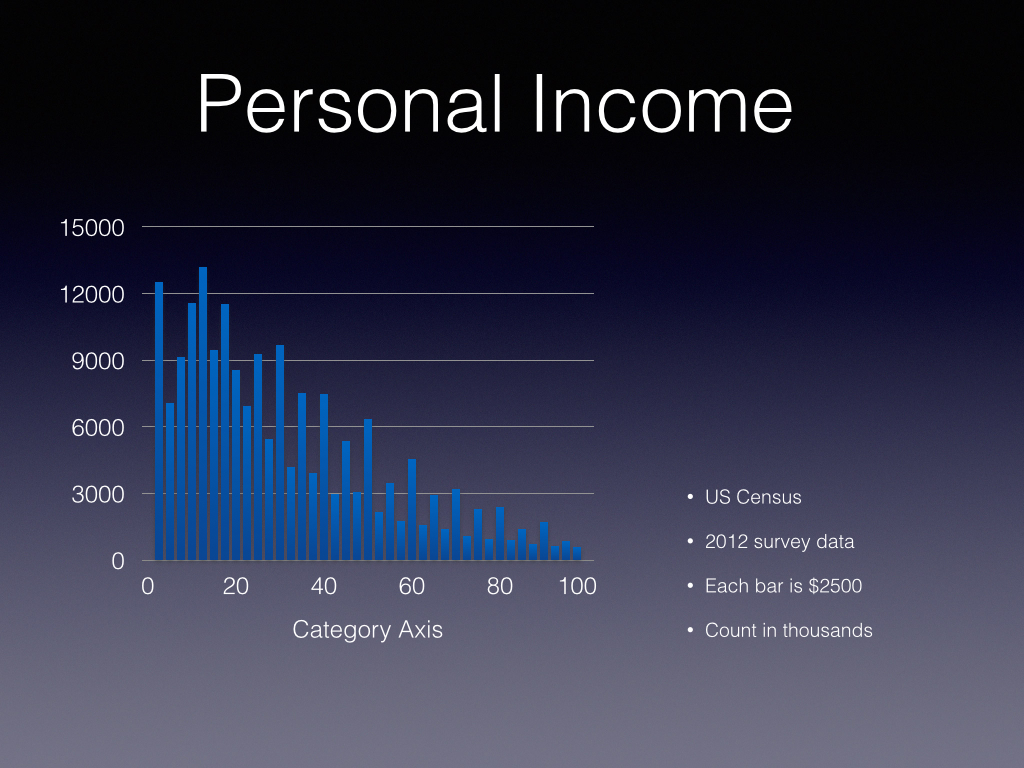
This figure shows the Census Bureau’s 2012 estimate of individual income density in the US. The bar height is proportional to the number of individuals in a $2500 band, for example from $40,000 to $42,999. Normalizing by the total number of people surveyed gives an estimate of the probability density function of income levels in the US.
There are some inconvenient truths here.
- The distribution is not Gaussian
- The distribution is bottom weighted
- The distribution is noisy
- There are high-low income band pairs, cause unknown
The important thing to take away is how income is distributed. A large swath of young (< 15) are counted as zero income. The median individual income of about $40,000 is well below the middle of the range considered in the survey ($50,000). Household income has a similar distribution with the median income being $51,000.
Percentile Stuff
Because the data is gnarly, it is helpful to think of it by percentiles as shown by the figure below.
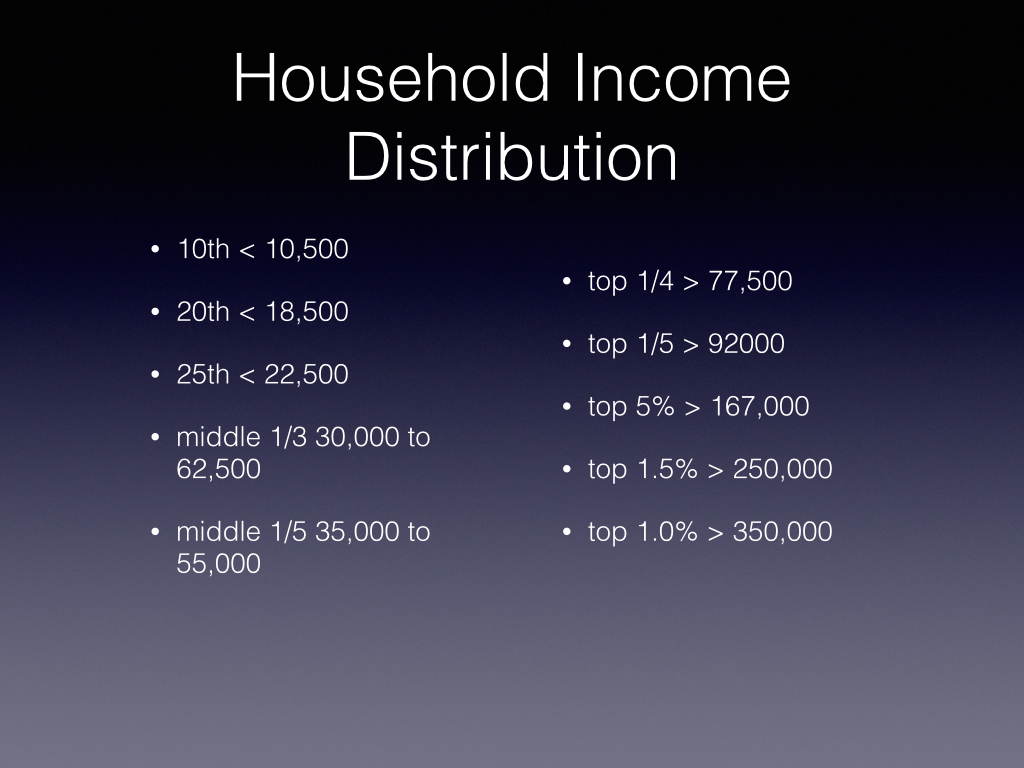
The figure shows some of the more important income bands. A percentile boundary represents the fraction of the population making less than that income level. For example, the tenth percentile tells us that 10 percent of the population earns less than $10,500. One quarter of us earn less than $22,500. One third of us earn between $30,000 and $62,500. Similarly, one quarter of us earn more than $77,000 and one fifth of us earn more than $92,000. Our doctors and dentists earn more than do 98 percent of us. The top 1.5% of income earners make more than $167,000 and to leave the 99% requires an income greater than $350,000.
Income and Standard of Living
Let’s interpret the income figures in terms of standard of living. Most importantly, the bottom 1/3 of us do not have the income to live independently. The middle 1/3 of us range from struggling to get by to independent with some savings. A 90th percentile income, although statistically wealthy, is not practically wealthy and requires careful choices of housing, automobiles, children’s education, etc.
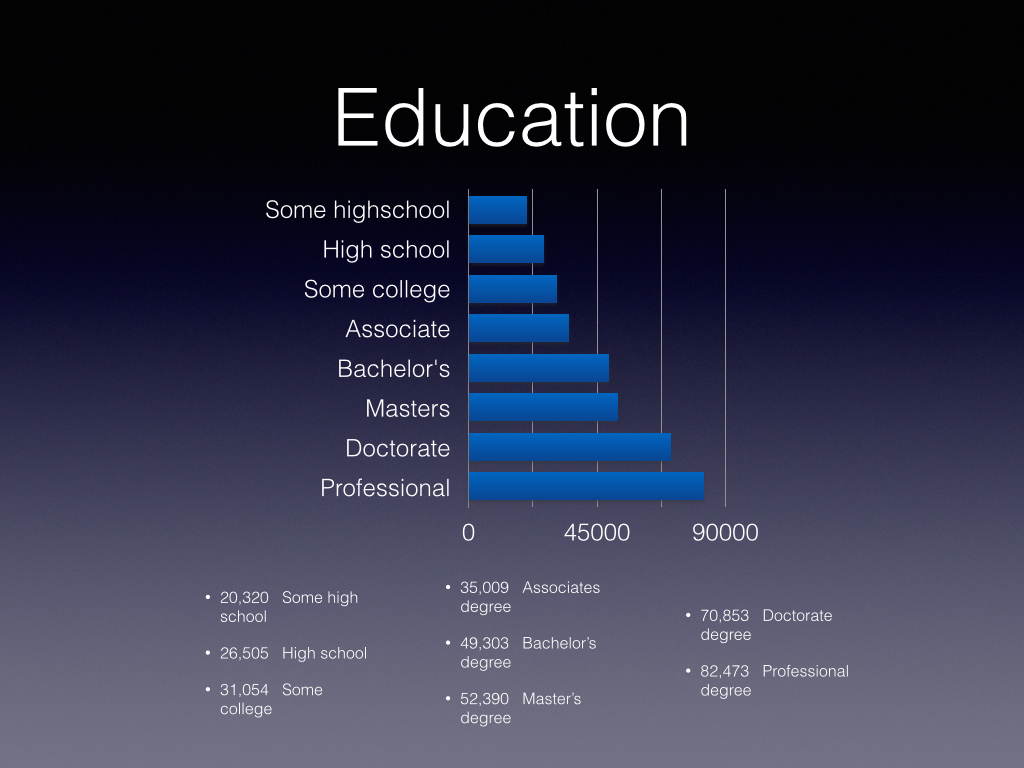
Occupation and Income
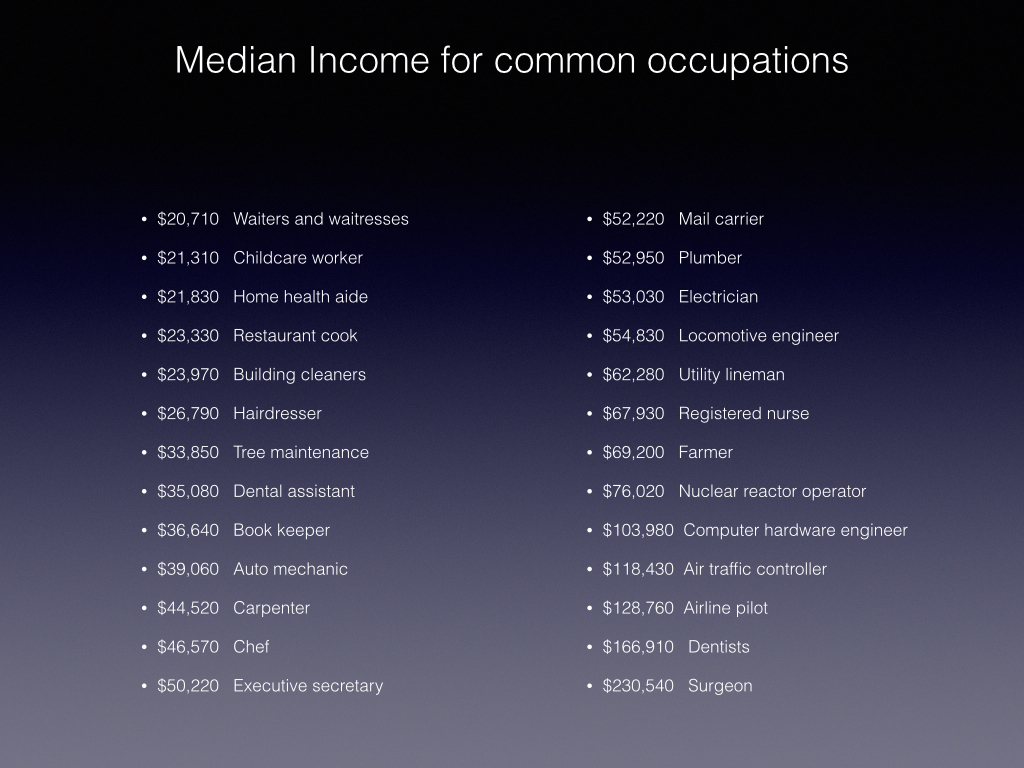
The table above shows median income for commonly encountered occupations. Median income is that income level dividing the occupation into two equal sized groups. Half make less than median and half make more. In choosing occupations from the reference, I was careful to choose occupations we commonly interact with. So barbers, auto mechanics, plumbers, waiters, cooks, janitors, dentists, surgeons, etc are all present as are some glamorous occupations like airline pilot.
Race and Income

The table above shows median household income by racial group. Just the facts, no opinions and no rewarming of racial stereotypes. But half of black and Hispanic households are struggling as are maybe half of all households.
Age and Income
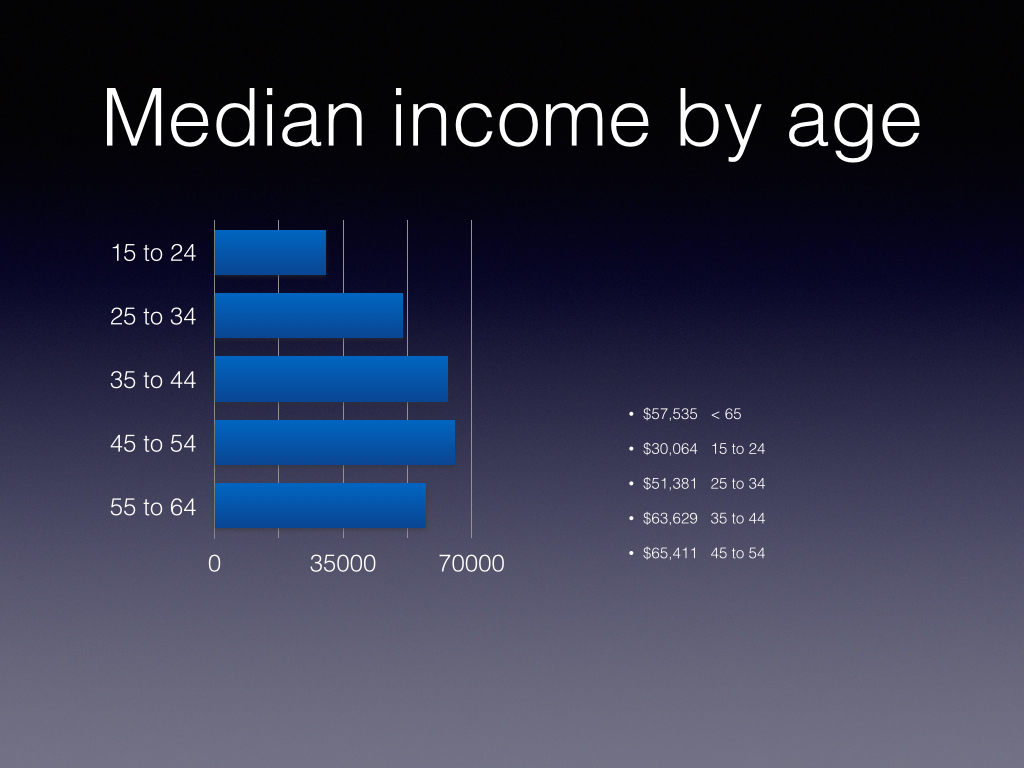
This figure shows median income by age group taking the 10 year slices commonly used.
Implications for Markets
Other than the racial disparities, skill, experience, and the emergent nature of economic system behavior go a long way toward explaining these data. Broadly consumed goods and services must be either inexpensive or subsidized. For example, we all need our hair cut. To be affordable places an upper bound on the fees for this service and the earnings in the profession. The providers of this service don’t have a lot of pricing power because half of their market earns less than $40,000.
Upward Mobility?
The data show that the keys to upward mobility are educational attainment and experience in our profession, trade or occupation. But demand for services sets limits on upward mobility. First, we can’t all be rock stars or brain surgeons. The demand is not there. As the data shows, the most important thing we can do is to finish high school. After that, we can attend a trade school, apprentice in a trade, or attend college to acquire professional knowledge and gain experience in our profession being attentive to changes in demand for our services.
Implications for policy
The data suggest a few implications for public policy
- Tax where there is money to be had, that is the top quartile.
- Services in broad demand must be inexpensive or subsidised
- Goods in broad demand must be inexpensive or subsidised
- Jobs are demand driven. Subsidizing the bottom 1/3 of us produces demand for goods and services. Subsidizing the top 1% produces speculation or savings.
And a few implications for personal choices.
- Education affords access to an occupation, trade, or profession that is in demand and pays well.
- Choose occupations, trades, or professions for which demand is growing or under-served.
- Choose occupations, trades, or professions that pay well
- Be attentive to changes in demand for your occupation, trade, or profession and follow demand.

You must be logged in to post a comment.